
Case Study
CAE Digital Transformation in Wheel Design:
Achieving an 82% Reduction in Analysis Report
Creation Workload Across Development
Transportation Equipment Manufacturer
Yamaha Motor Co., Ltd.

Transforming the CAE Workflow to Improve Efficiency
and Enable Resource Allocation Toward Strengthening
Competitiveness
Yamaha Motor Co., Ltd. operates across a wide range of business domains that support people’s lives, including motorcycles, where it holds a world-leading market share, as well as marine products, electric-assist bicycles, and robotics products.
As one of its key initiatives from FY2025 to FY2027, the company is working to strengthen the competitiveness of its core businesses. In addition, it is promoting the simplification and transformation of its business structure by utilizing IT, digital technologies, and data to achieve sustainable growth.
Under this policy, the Wheel Group has been required to pursue initiatives aimed at improving operational efficiency, enhancing quality, and creating new value. Although analysis work had already been completed, development was delayed due to report creation. This initiative was implemented to resolve that issue.
Solving Challenges in Analysis Report Creation Across
Development by Moving Away from 100% Manual Work
Within design and development operations, which range from design to analysis and drafting, efficiency improvements had progressed in some 3D model creation processes. However, automation in the analysis domain remained difficult, and securing time to work on efficiency improvements continued to be a challenge.
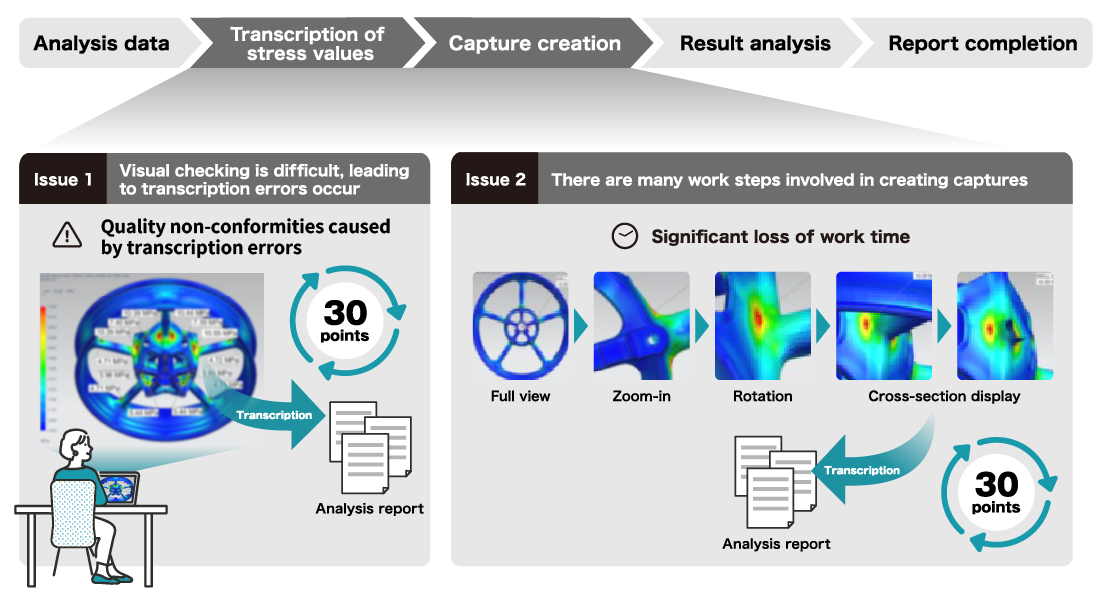
In particular, creating analysis reports required many processes to be carried out manually, placing a significant burden on the field. Furthermore, when analysis tasks were assigned to other personnel, it was necessary to confirm whether analysis conditions, such as load values in the analysis model, had been set correctly. This manual work was not limited to the Wheel Group; it was a common challenge across other development departments as well.
Additionally, wheel analysis involves various types of analysis, such as stress, displacement, and eigenvalue analysis, making it suitable for application to other components. Therefore, wheel analysis was selected as the subject for efficiency improvement activities aimed at horizontal deployment across development. The initiative was carried out together with SOLIZE PARTNERS, which could provide support from requirements definition through tool development based on its expertise in design and analysis.
Defining Project Requirements to Reduce the Burden of
Analysis Report
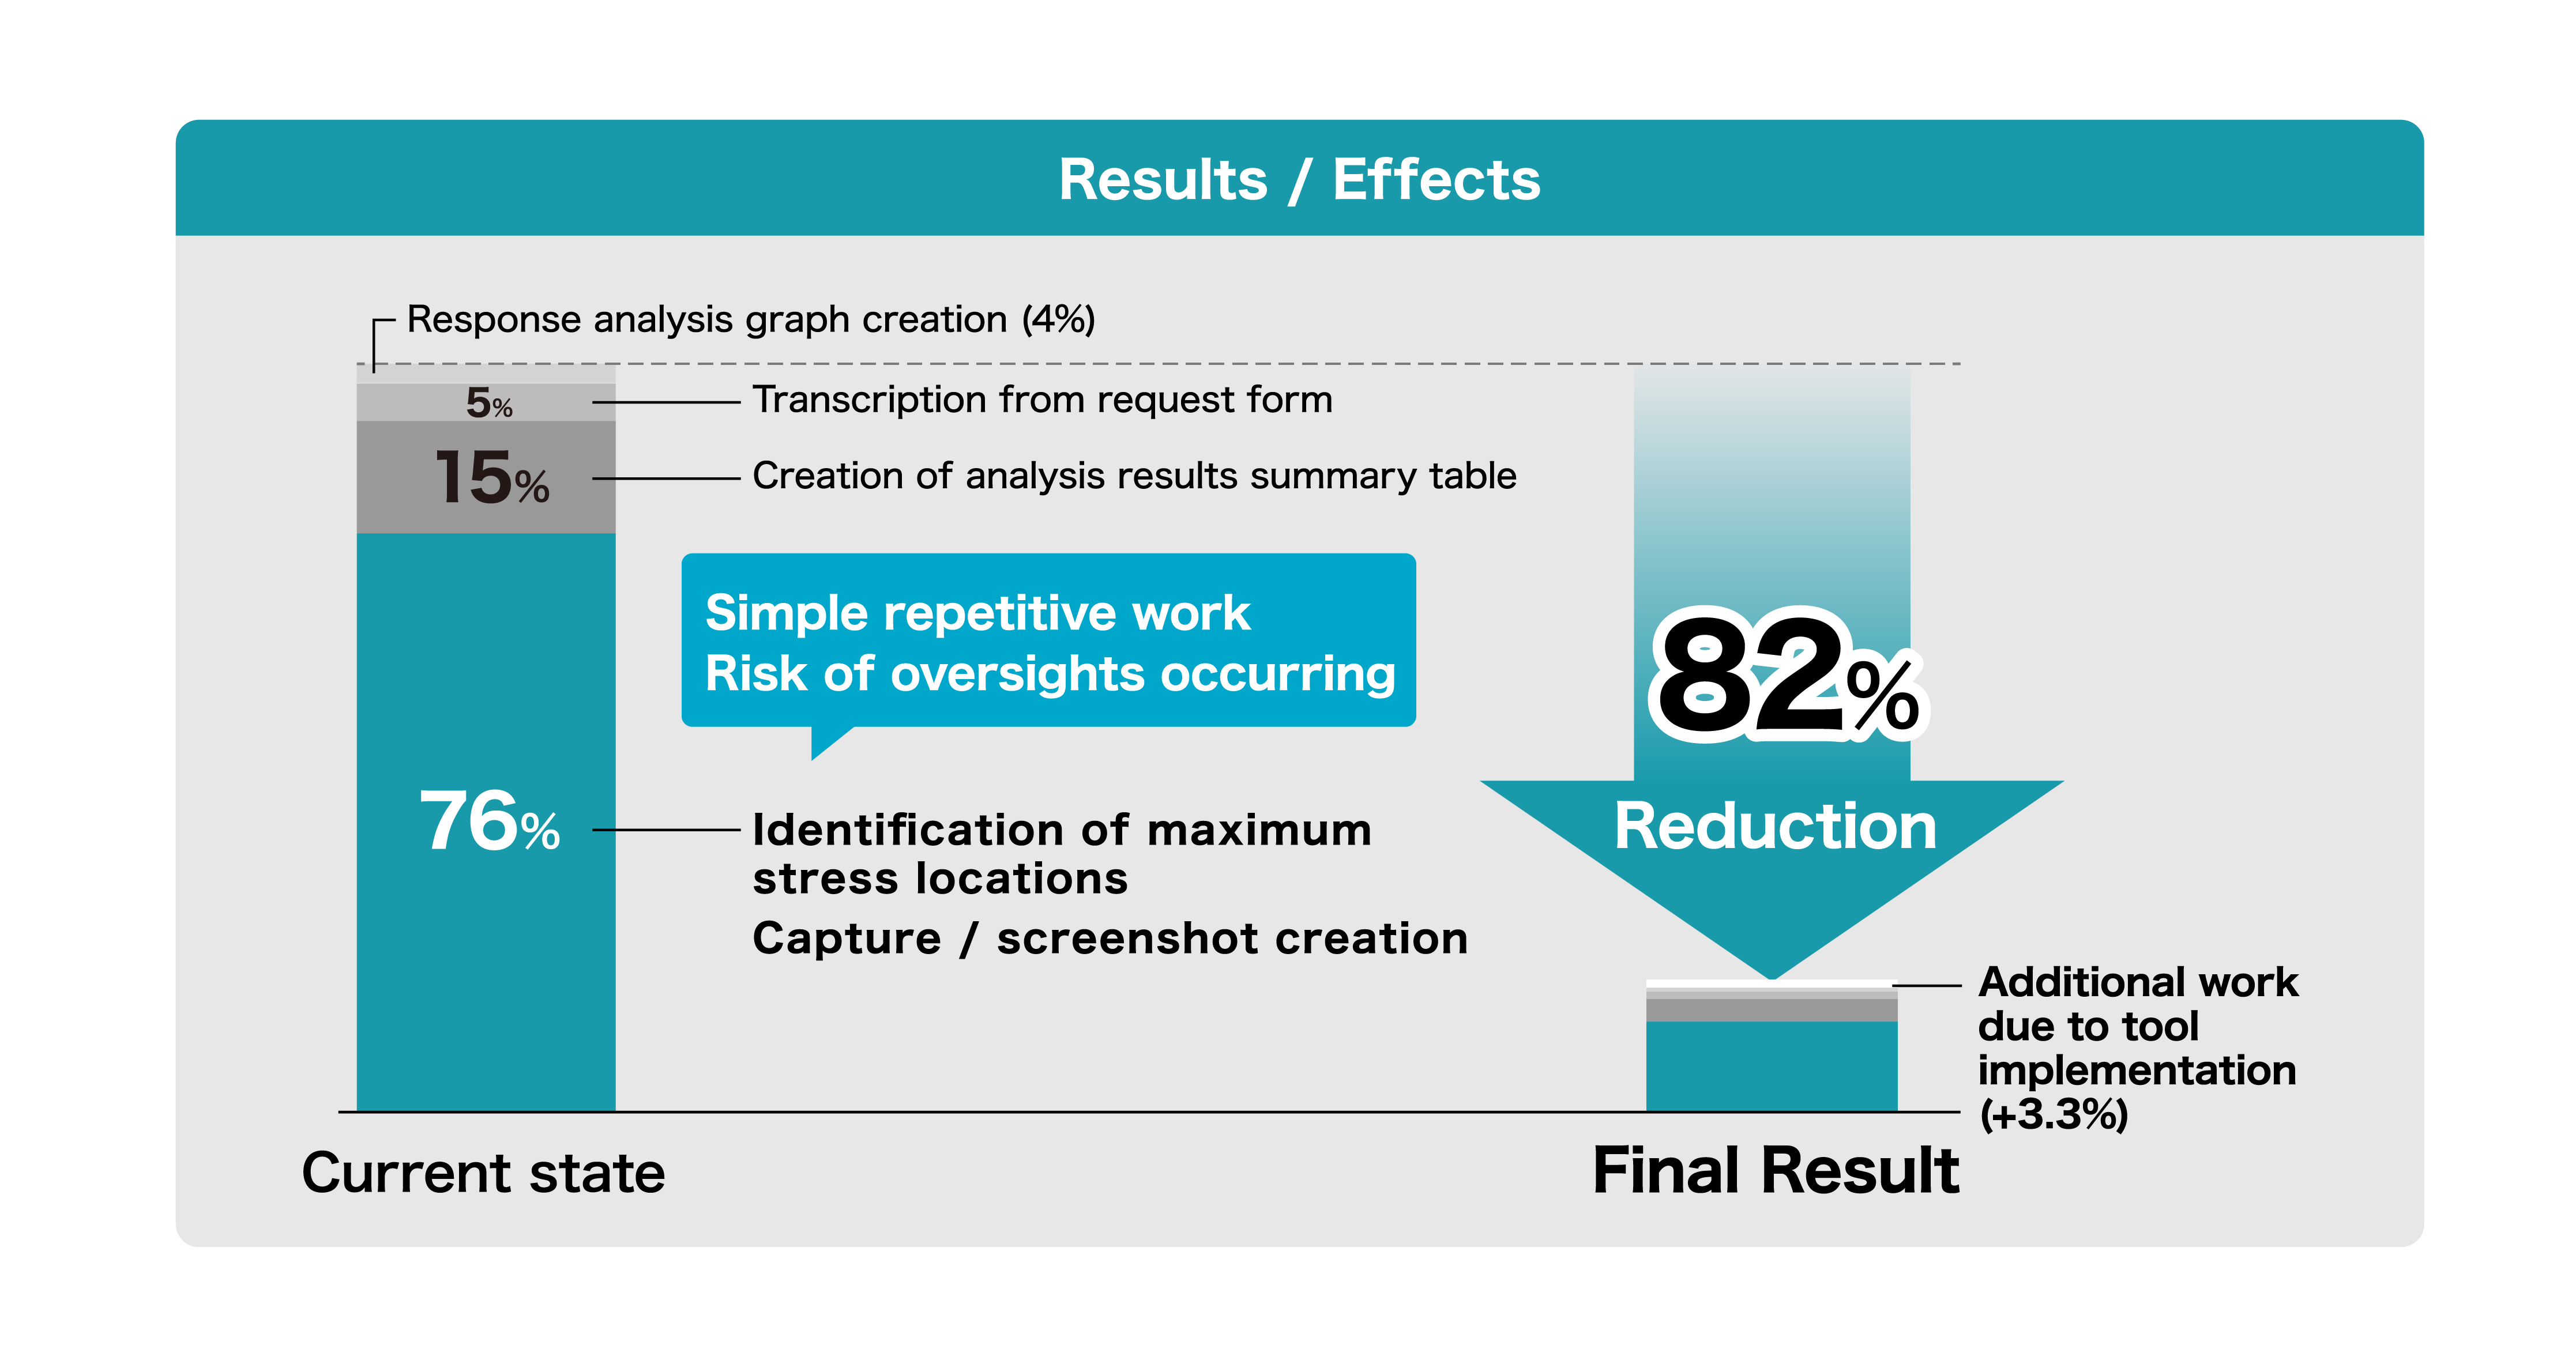
As a preliminary phase before full-scale tool development, the current processes were first visualized, and the workload for each step was clarified. Next, from a technical perspective, the feasibility of automation was examined, and the scope of efficiency improvements and the concrete image of the tool were organized. Based on this, the initiative was started with the goal of achieving an 82% reduction in the workload required for analysis report creation.
In the requirements definition phase, thorough interviews and confirmation of the usual workflow were conducted, with emphasis placed on deeply understanding the essential aspects of “what kind of work was being performed and for what purpose.”
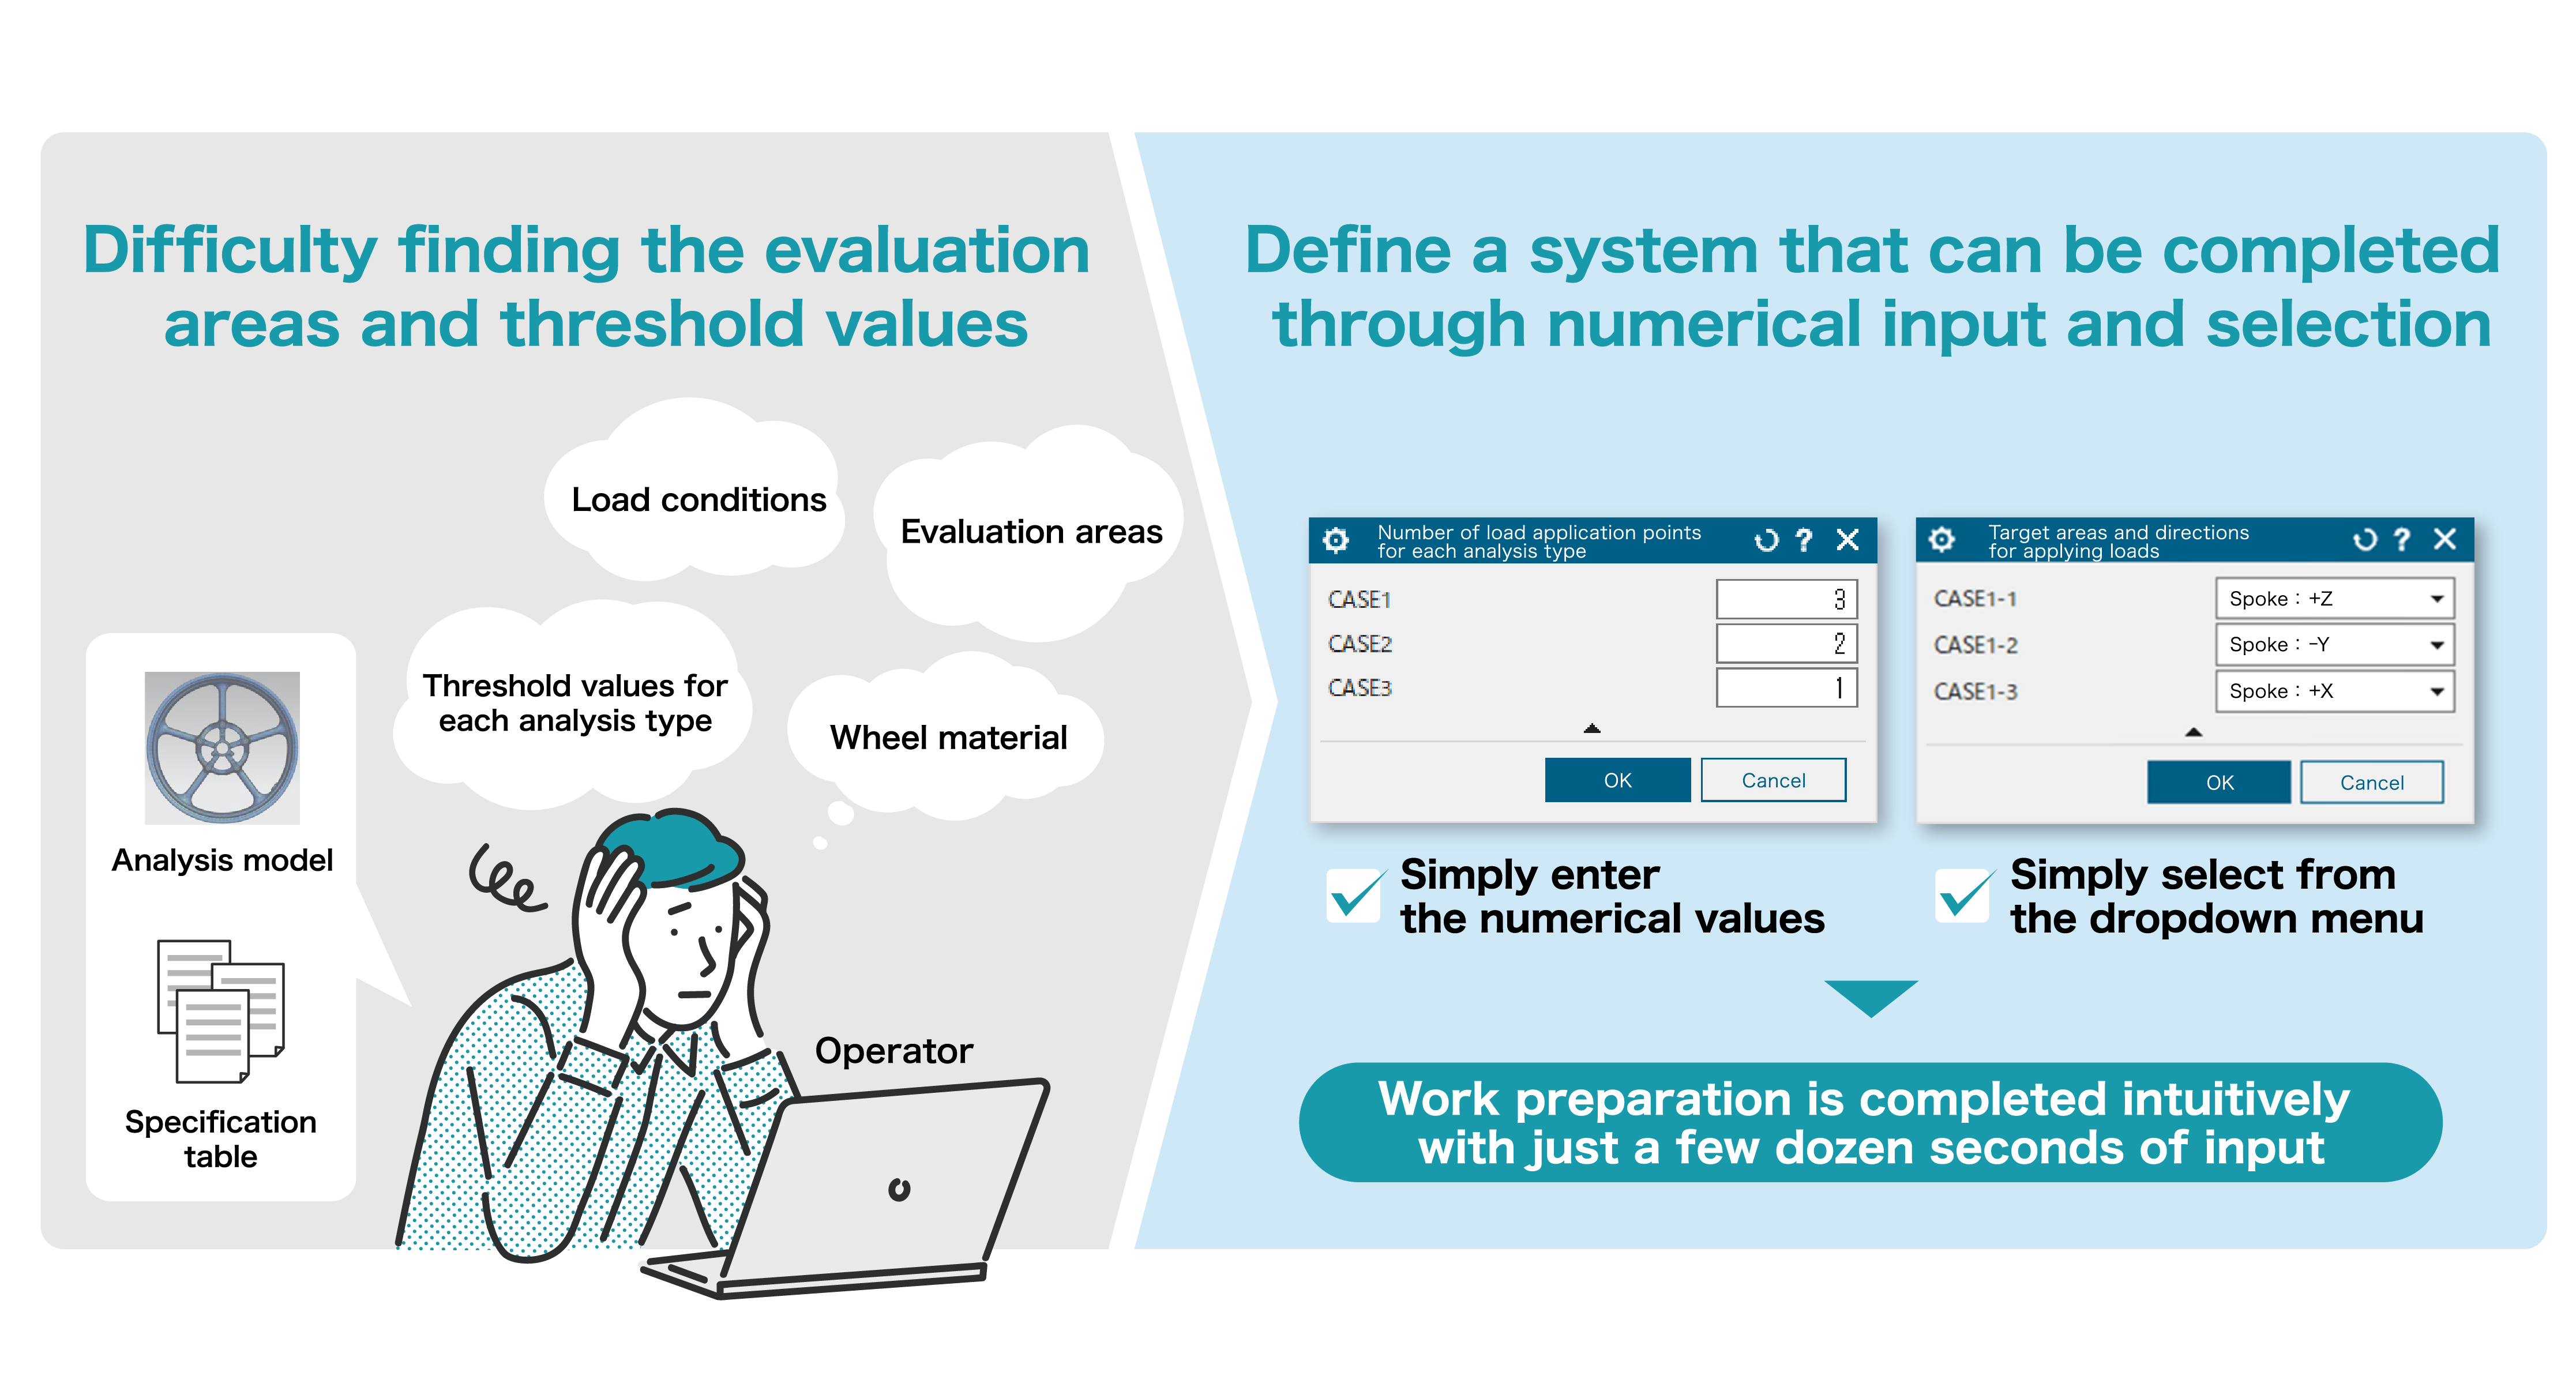
When considering the tool specifications, the aim was to reduce the burden on operators and create a user interface (UI) that anyone could use without hesitation. At the same time, importance was placed on maintaining compatibility with current workflows while ensuring that the system remained intuitive and easy to use. This allowed the tool to integrate seamlessly with existing processes.
Specifically, a system was defined to obtain maximum stress values for each generated mesh without changing the current analysis model creation procedures or adding additional burden. In addition, to improve usability, a system was defined that allows the UI and analysis model to be linked simply by inputting the model specifications in advance.
Through these processes, careful consideration was carried out from the early stages to ensure that the existing workflow could be maintained without increasing the on-site workload. As a result, a requirements definition document was created with the aim of improving operational efficiency and achieving an easy-to-use UI.
Eliminating Manual Workload Across Development Through a
System That Achieves a 78% Workload Reduction
The creation of analysis reports required many manual processes, and was a common challenge not only for the Wheel Group but also for other development departments.
Therefore, to solve this company-wide development issue, this initiative focused on building a highly versatile analysis integration system that can support various components and operations. Unlike typical tools, which tend to have fixed specifications for specific parts, this system allows those fixed parts to be flexibly modified.
From the beginning of the initiative, the system was designed with future expansion across development in mind. Reports from each department were compared and analyzed, and requirements and specifications were systematically organized to meet diverse needs while accounting for differences in formats and workflows. Furthermore, trials were conducted before the tool specifications were fully finalized, and feedback was incorporated not only on wheel-specific functions but also from analysts responsible for other components, allowing on-site feedback to be reflected quickly.
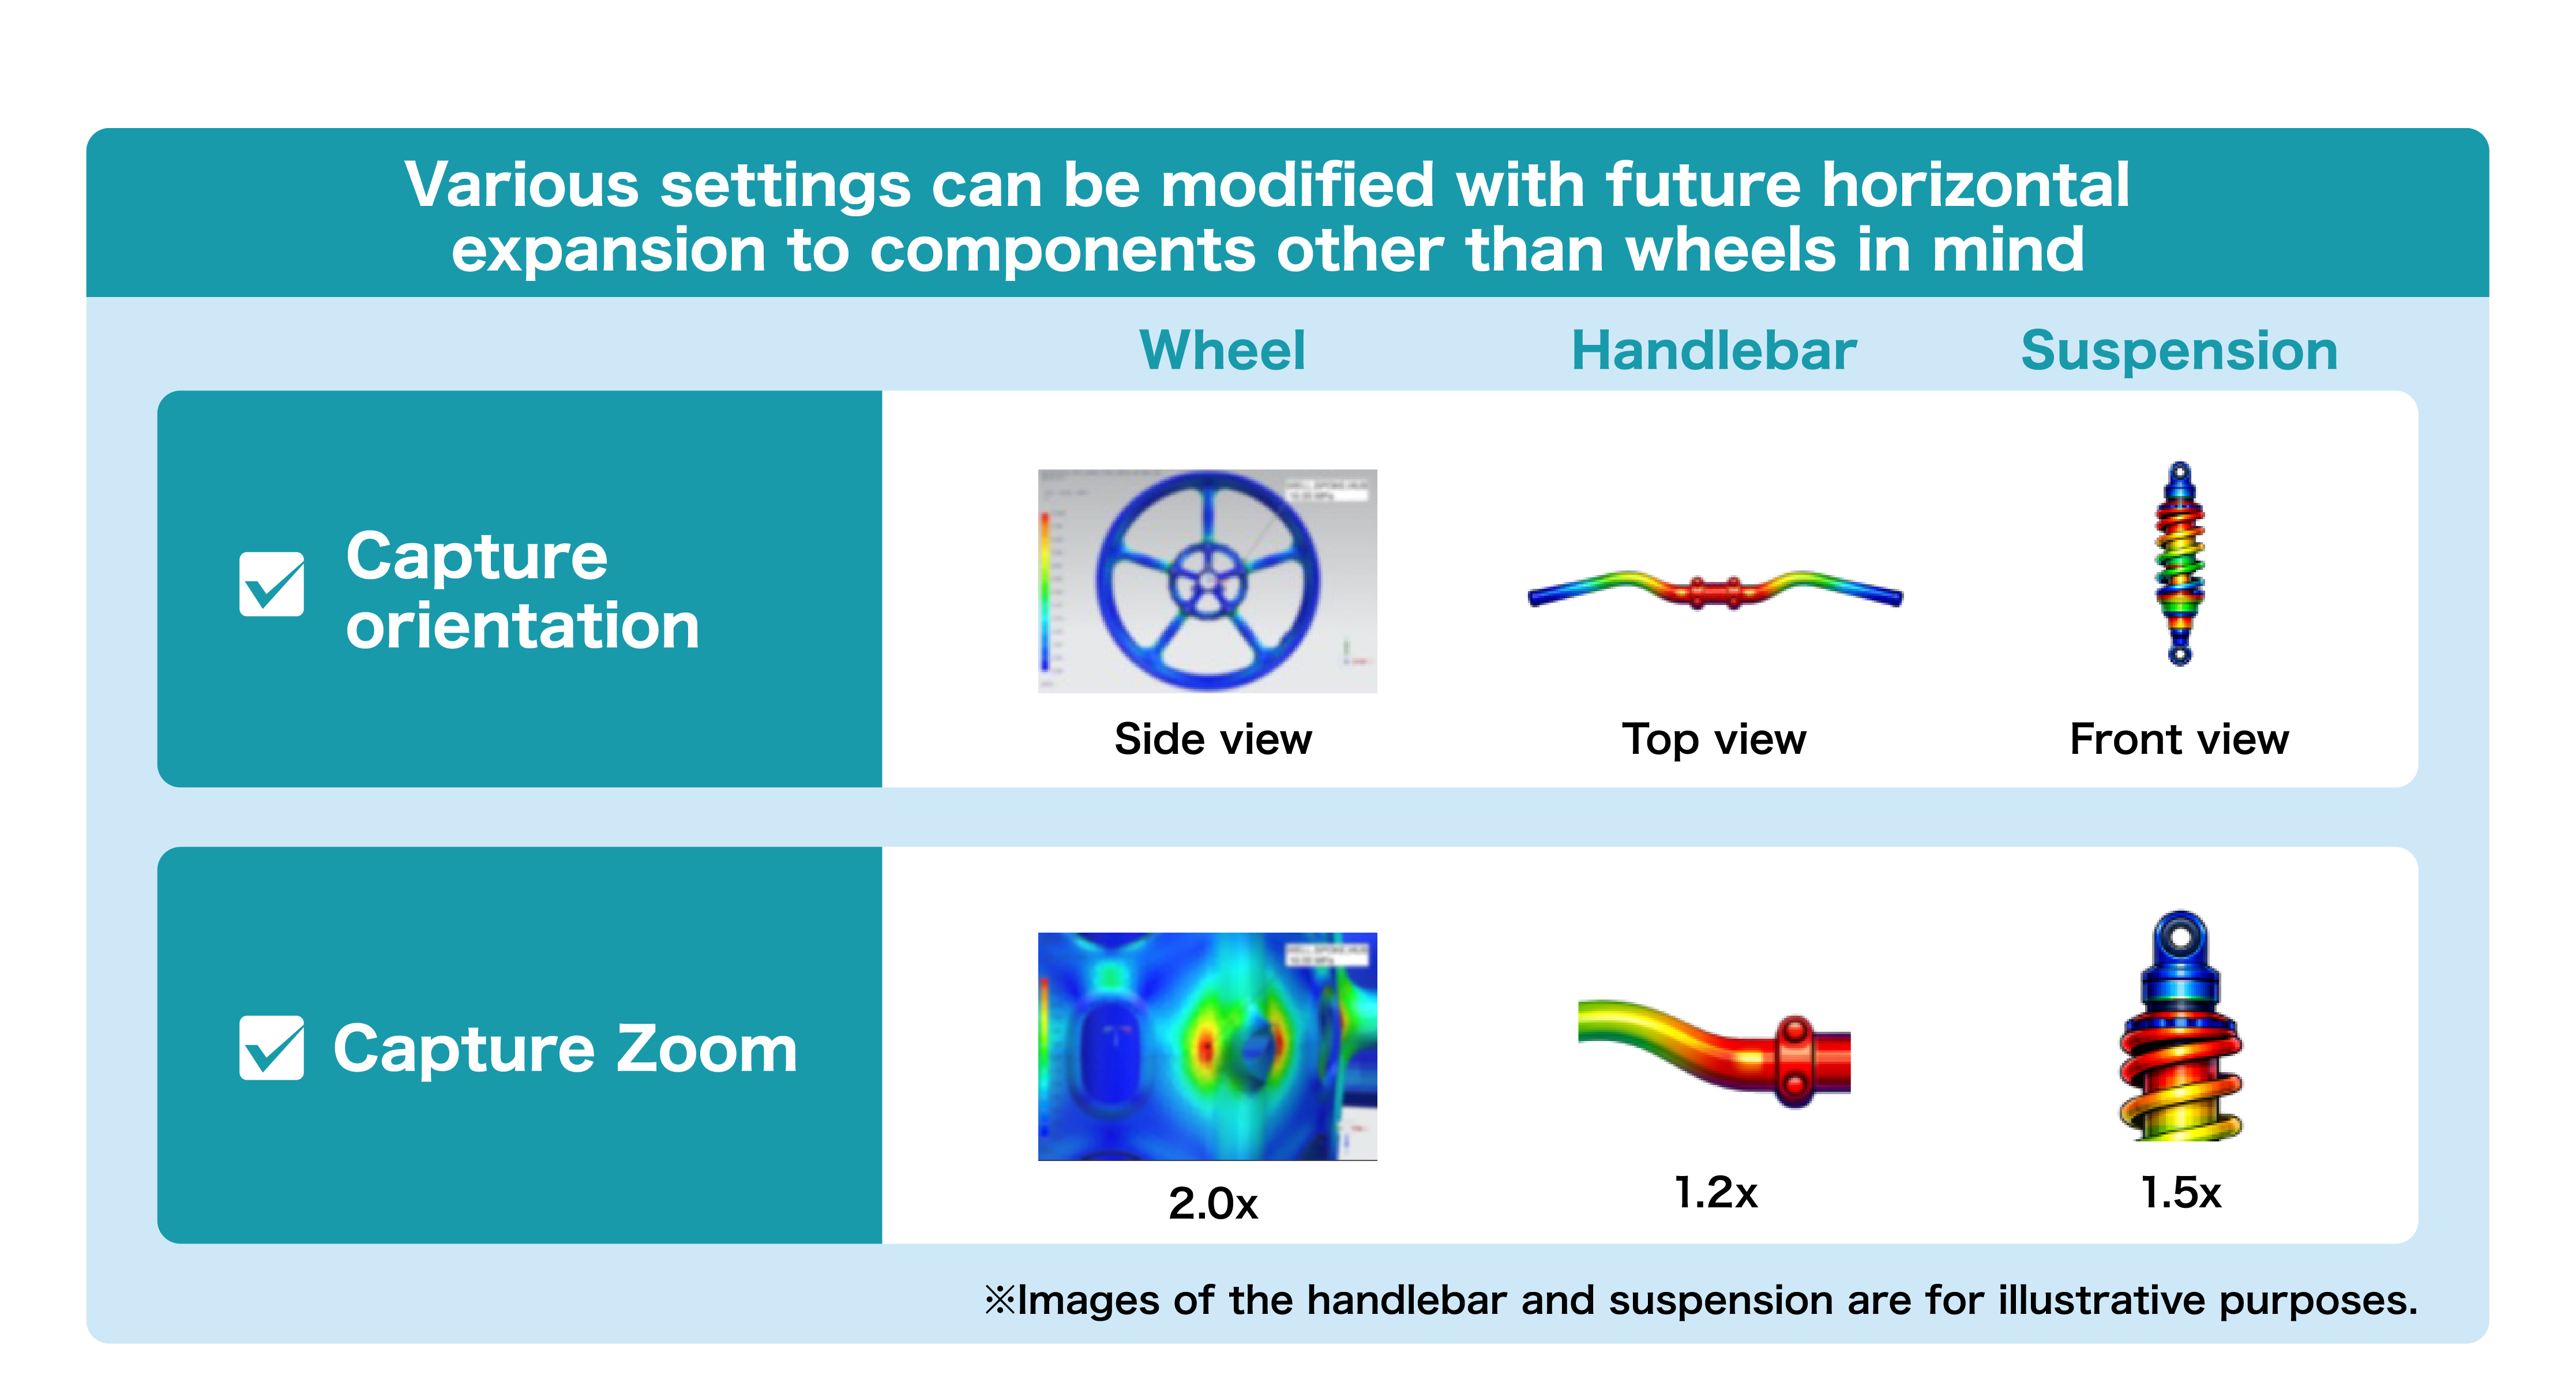
Specifically, mechanisms were designed to flexibly configure the output conditions and display items required for report creation. These included stress values, capture image names, display directions, magnification, cross-sectional positions, and displacement and animation display settings. These mechanisms were designed not only for wheels but also for other components, enabling the system to adapt to different operational environments and additional requests. In addition, analysis result output tables that can be semi-automatically generated through the flexible UI were made linkable with analysis models. This established a foundation that can be expanded to various analysis models across other development departments.
Through these initiatives, a foundation was established for deploying an analysis report creation tool across development. The tool is capable of achieving a 78% workload reduction and enables flexible support not only for wheel components but also for other components.
Achieving an 82% Workload Reduction Through the Thorough
Automation of Manual Work
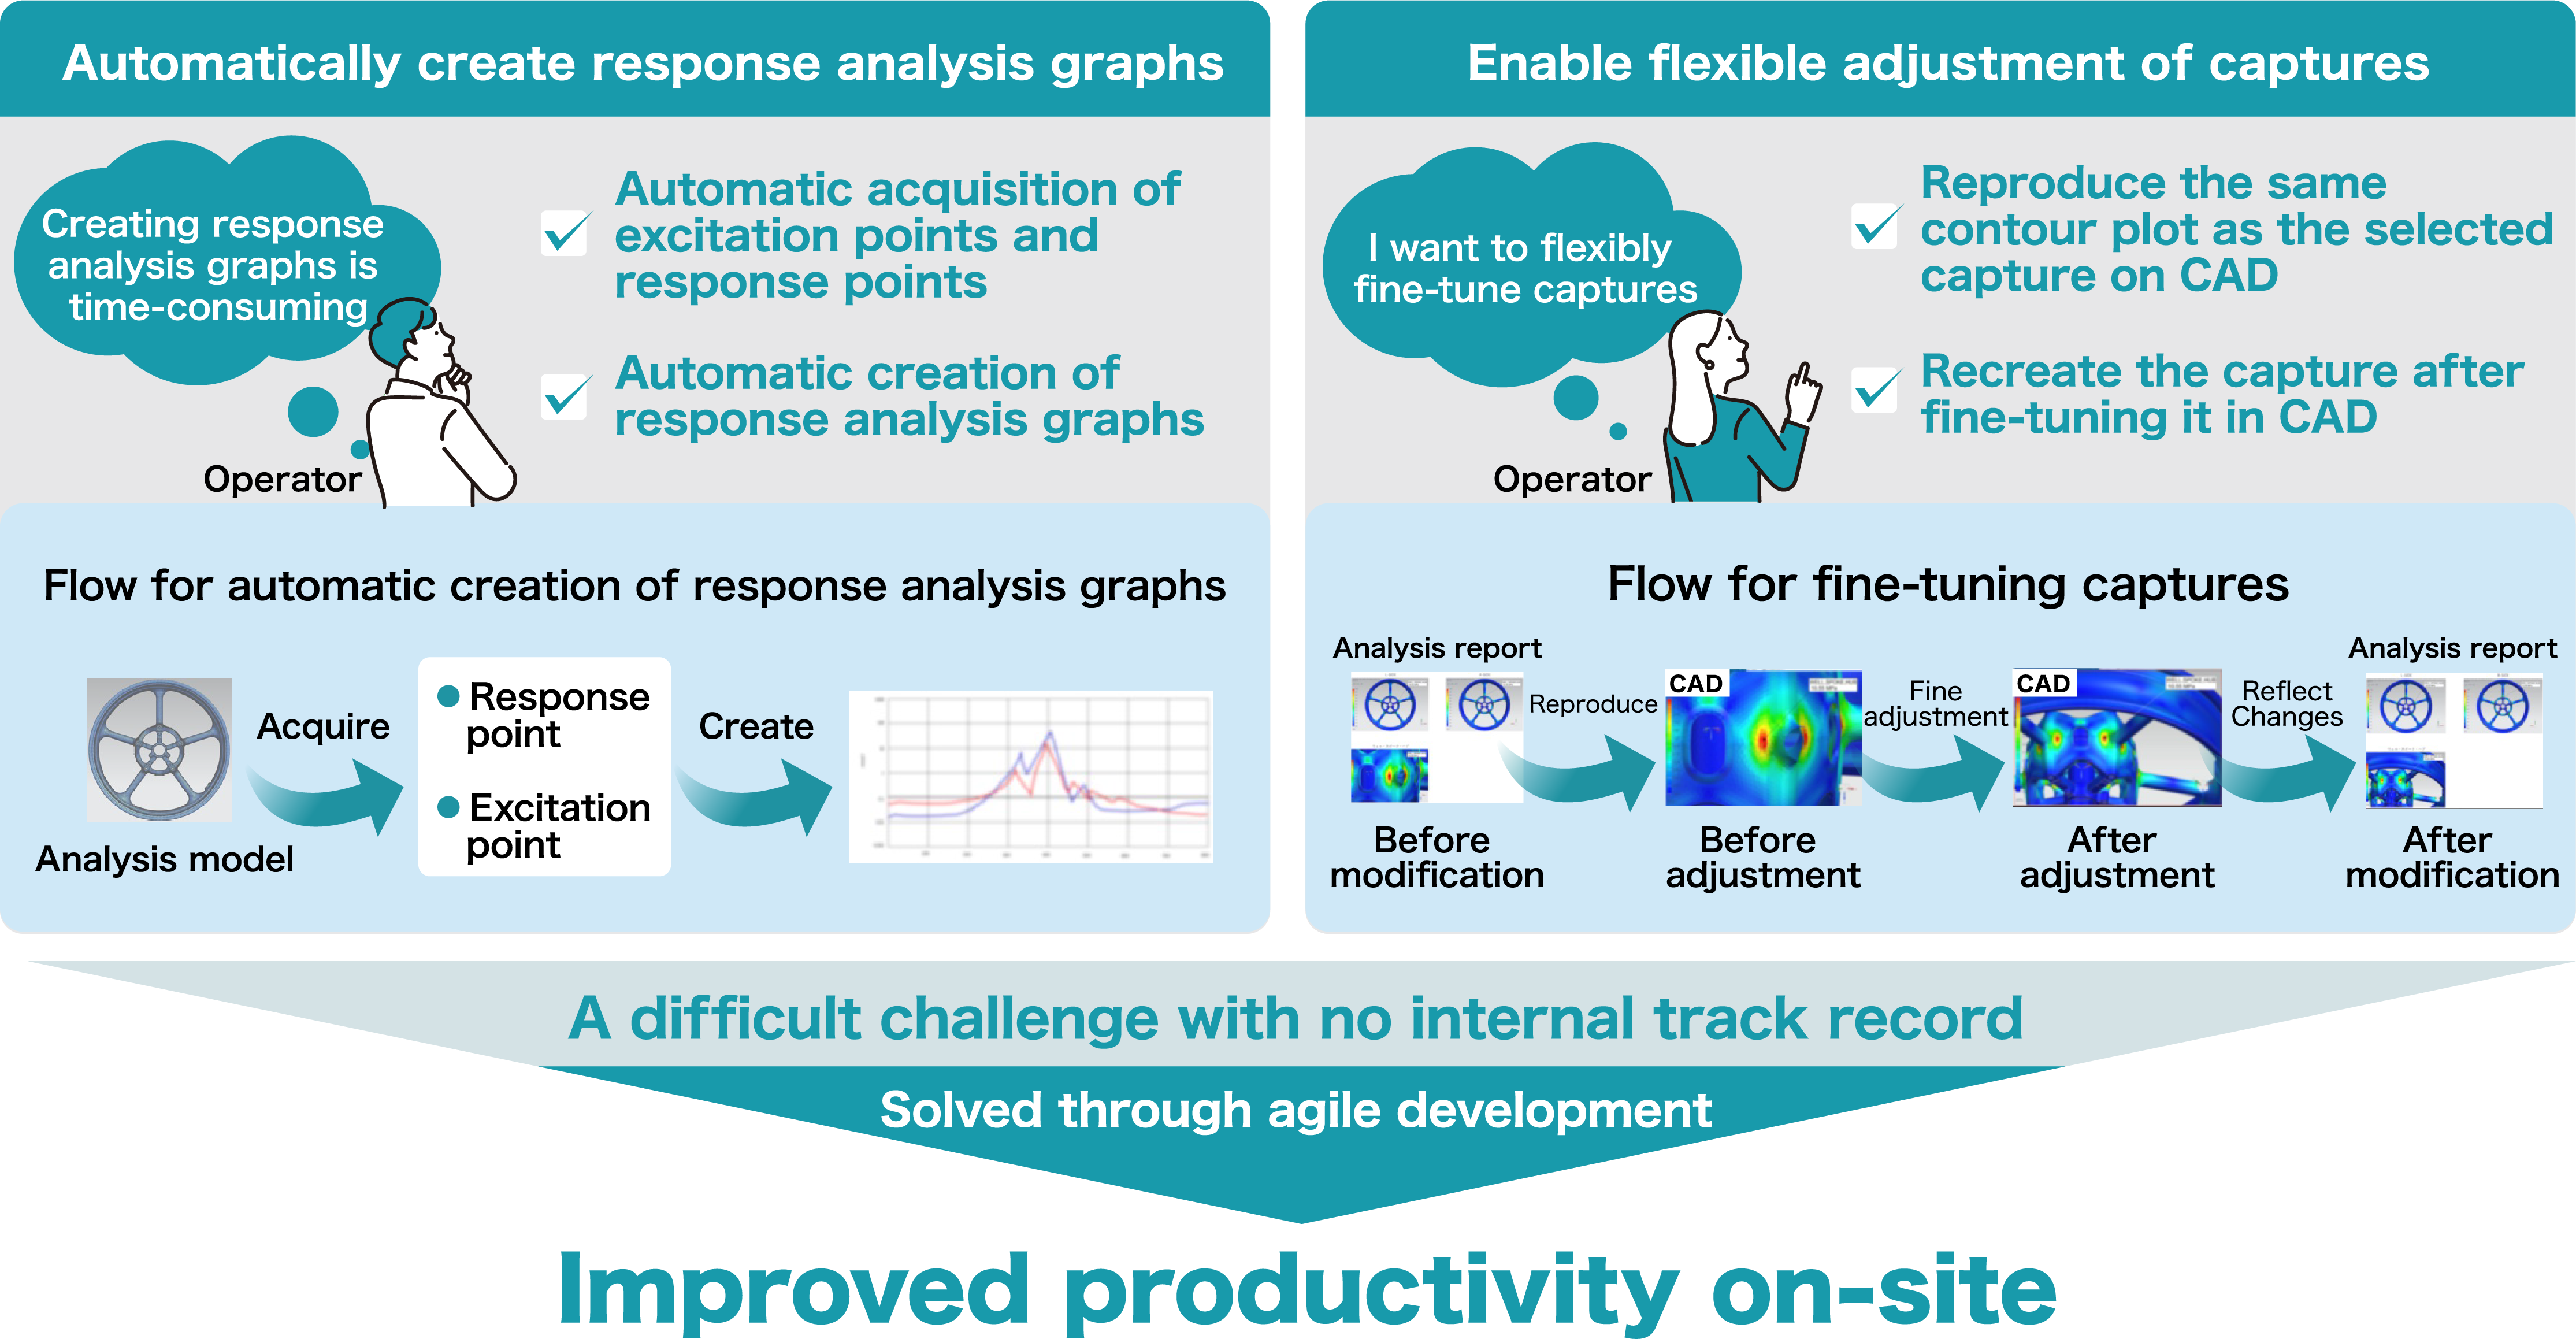
An automated analysis report tool was developed to significantly reduce the workload required for creating analysis reports. Previous manual tasks related to analysis conditions were automated, including the entry of weight, moment of inertia, and load values. The tool also automated the transcription of analysis results, such as stress and displacement values, as well as the creation of contour image captures for each analysis result and the output of eigenvalue animations. In addition, the complex series of processes from selecting excitation and response points to generating response analysis graphs was automated. Functions such as report cover creation support, capture correction support, and report generation in new files were also implemented. By enabling the automatic acquisition of load setting values, the tool made it possible to reduce the workload of verification tasks within the analysis model and prevent quality non-conformities caused by human error.
In particular, the processes for creating response analysis graphs and freely modifying captured images involved high technical difficulty, and their feasibility remained unclear until midway through the project. However, by applying agile development methods to address these challenges, it was ultimately possible to automate response analysis graph creation and recreate the state at the time of capture on CAD with result labels. This enabled users to flexibly modify or reacquire the captured images. In addition, the tool was designed to align with actual business processes, allowing preparation before tool execution to be completed within several tens of seconds. Together with a thorough pursuit of automation for manual work, the initiative ultimately achieved an 82% reduction in the workload required for analysis report creation.
The automated analysis reporting tool has delivered significant effects in all aspects of Quality (Q), Delivery (D), and Cost (C).
Q: Quality Assurance
The tool eliminates human error by preventing extraction and transcription mistakes caused by manual work. It also improves report consistency by standardizing report layouts.
D: Workload Reduction
The tool improves work speed by automating report creation and shortening lead time. It also reduces the risk of delivery delays by eliminating dependence on individual work.
C: Reduction of Dependency on Individuals
The resources created through efficiency improvements can be reallocated to higher value-added work. In addition, standardization reduces the burden of training new employees and handing over tasks.
As a result, bottlenecks in analysis operations were resolved, contributing to the shortening of overall development lead time.
Broadening the Scope of Application Across Development
Through the development of the automated analysis report tool, the Wheel Group has become able to create analysis reports almost instantly, resulting in significant QDC improvements within product development. Going forward, the company aims to establish a system that enables designers to focus on higher value-added work.
These results have been actively communicated through internal presentations and company-wide technical exhibitions, receiving high recognition. As a result, the initiative has begun to expand horizontally into additional departments, and efforts to improve development efficiency are now underway in areas and components beyond wheels.
Moving forward, the expansion of this initiative across development is expected to further promote efficiency and standardization, contributing to improved productivity and competitiveness across the entire organization.
“By automating the creation of analysis reports, we were able to significantly improve work efficiency. As report quality became more stable, it became easier to search for necessary information and compare conditions, enabling faster consideration even in downstream design processes. By building a system aligned with our workflow, we established a practical and user-friendly solution suited to our operations. Going forward, we would like to expand its application to similar areas.”

Satoshi Ohashi Director
Motorcycle Vehicle Development Division;
MC Vehicle Development Department, Functional Module Development Department
“Through this initiative, we were able to achieve both efficiency and stable quality by streamlining routine design operations while incorporating the expertise of an external partner. In addition, SOLIZE provided various proposals in response to our requirements, which we feel contributed to this high level of completion. Going forward, we would like to use this as a successful case and promote its expansion across development.”

Hiroshi Niimi Group Leader: Wheel Group
Motorcycle Vehicle Development Division;
MC Vehicle Development Department, Functional Module Development Department
“As digital technologies such as AI, IoT, and big data continue to evolve and accelerate competitiveness, we believe that enhancing on-site capabilities is a very important mission for delivering new products to our customers. This initiative to build an automated analysis report tool has produced visible results and has also made it possible to prevent human errors in advance. Moving forward, we will continue to use this development tool as a starting point to further enhance our on-site capabilities.”

Masaya Yamaguchi Senior Chief: Wheel Group
Motorcycle Vehicle Development Division;
MC Vehicle Development Department, Functional Module Development Department
※Departments and titles are as of the time this initiative was conducted.


※3DEXPERIENCE、Compass アイコン、3DS ロゴ、CATIA、BIOVIA、GEOVIA、SOLIDWORKS、3DVIA、ENOVIA、EXALEAD、NETVIBES、MEDIDATA、CENTRIC PLM、3DEXCITE、SIMULIA、DELMIA およびIFWE は、アメリカ合衆国、またはその他の国における、ダッソー・システムズ (ヴェルサイユ商業登記所に登記番号B 322 306 440 で登録された、フランスにおける欧州会社) またはその子会社の登録商標または商標です。
※Ansys®、及びその他すべてのANSYS, Inc.の製品名は、ANSYS, Inc.またはその子会社の米国およびその他の国における商標または登録商標です。
※BETA CAE Systemsの会社名および製品の商標、商号、ロゴは、スイス、欧州、米国、およびその他の国の法律に基づき保護および/または登録されている場合があります。無断での使用または複製は固く禁じられています。
※出典:アルテアエンジニアリング株式会社
©2026 SOLIZE PARTNERS Corporation. All rights reserved.